import numpy as np
import matplotlib.pyplot as plt
from mpl_toolkits.mplot3d import Axes3D
# Generate values for x
x = np.linspace(-2*np.pi, 2*np.pi, 800)
# Calculate the real and imaginary parts of e^(ix)
re = np.cos(x) # Real part
im = np.sin(x) # Imaginary part
# Plotting
fig = plt.figure(figsize=(20, 16))
ax = fig.add_subplot(111, projection='3d')
# Plotting real and imaginary parts
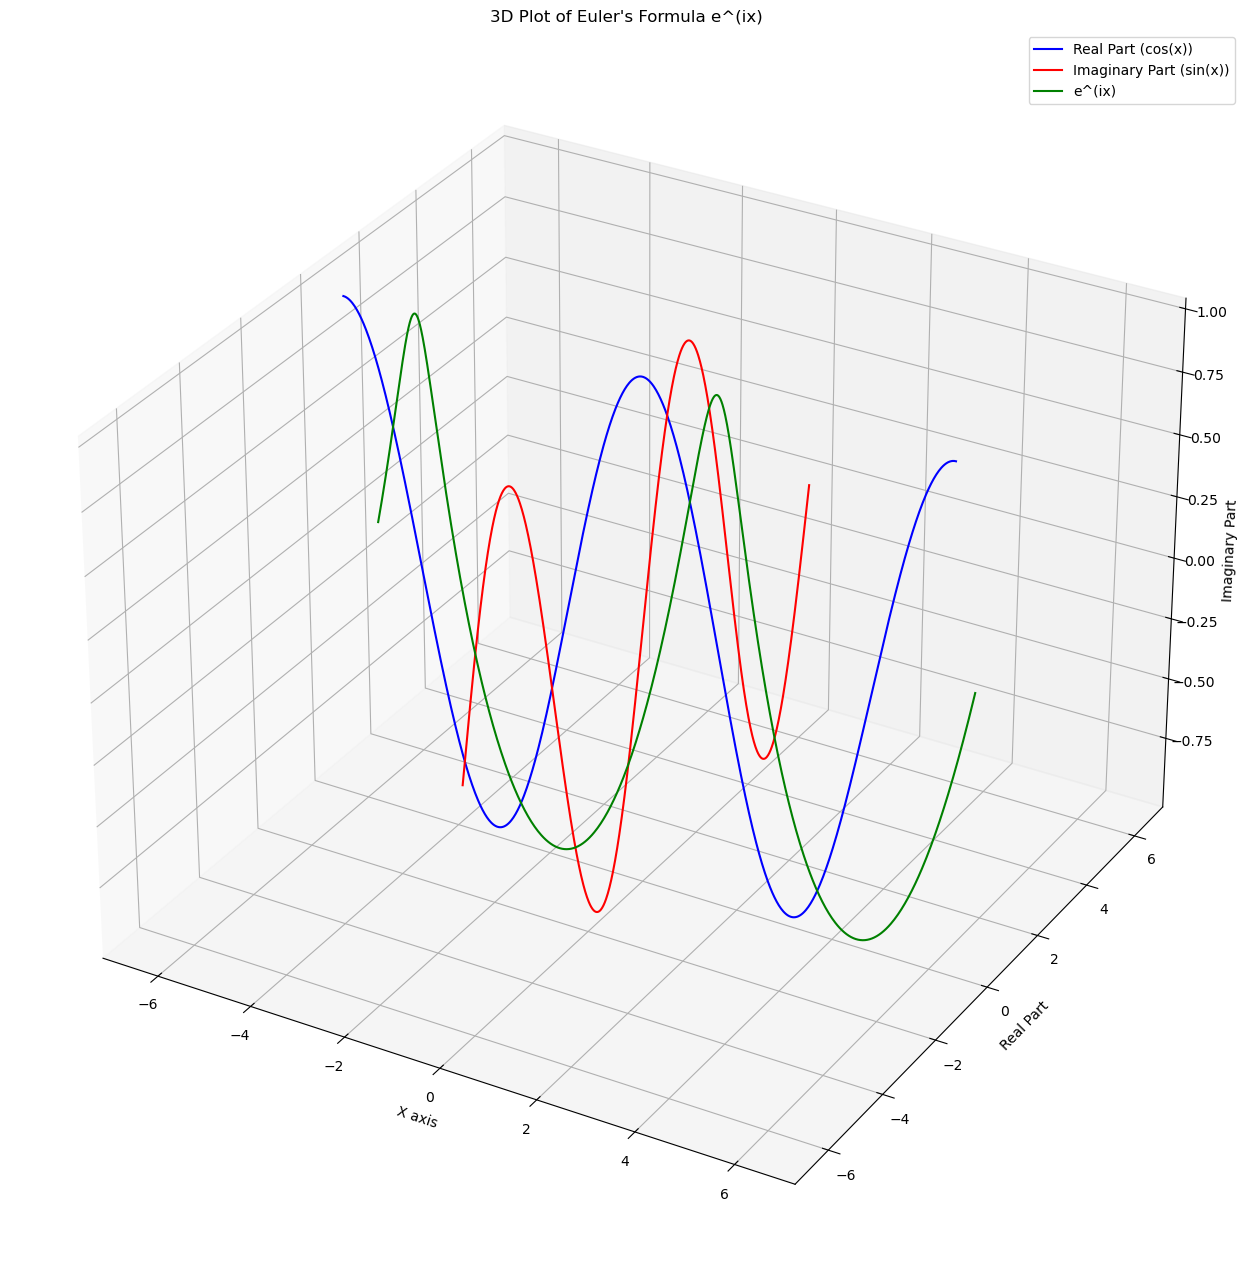
ax.plot(x, re, zs=0, zdir='y', label='Real Part (cos(x))', color='blue')
ax.plot(x, im, zs=0, zdir='x', label='Imaginary Part (sin(x))', color='red')
# Plotting the complex function e^(ix)
ax.plot(x, re, im, label='e^(ix)', color='green')
# Labels and title
ax.set_xlabel('X axis')
ax.set_ylabel('Real Part')
ax.set_zlabel('Imaginary Part')
ax.set_title('3D Plot of Euler\'s Formula e^(ix)')
# Legend
ax.legend()
plt.show()